
Tourism in Italy Statistics: Navigating Trends and Insights
Updated On: January 31, 2024 by  Yasmin Elwan
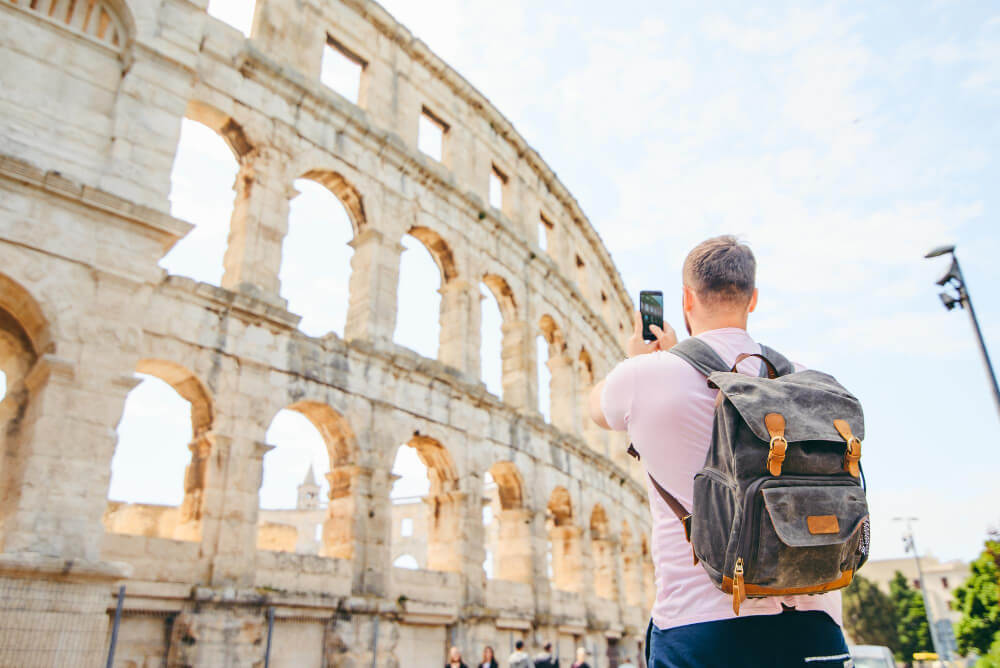
Italy; the mere name conjures iconic images: the Colosseum’s weathered stones whispering of gladiatorial battles, the sun-drenched piazzas of Rome buzzing with life, and the gondolas gliding through Venice’s watery labyrinth. But beyond these picture-perfect landmarks, a vibrant tapestry of experiences awaits, woven from charming villages, breathtaking landscapes, and a rich cultural heritage. To truly understand the magic of Italy, let’s delve into the tourism in Italy statistics, the hidden numbers that reveal what truly draws travellers from every corner of the globe.
Why are Tourism Statistics Important?
Tourism statistics are important because they help us understand the impact of tourism on the economy and society. They provide valuable insights into the number of tourists visiting a particular place, the amount of money they spend, and the types of activities they engage in. This information can be used to make informed decisions about how to allocate resources and develop policies that support the growth of the tourism industry.
According to the United Nations World Tourism Organisation (UNWTO), tourism statistics are systematically gathered from countries and territories around the world into a vast database that constitutes the most comprehensive statistical information available on the tourism sector. The data collected includes information on the number of international tourist arrivals, the amount of money spent by tourists, and the number of jobs created by the tourism industry.
Tourism is a key driver of economic growth and recovery, especially in countries where tourism represents a high percentage of gross domestic product (GDP). The International Monetary Fund (IMF) has identified tourism as a key sector for growth, and the World Economic Outlook (WEO) Report states that economies with “large travel and tourism sectors” show strong economic resilience and robust levels of economic activity.
Domestic Tourism in Italy Statistics
For centuries, Italy has captivated the world with its ancient ruins, artistic treasures, and sun-kissed landscapes. But what about Italians themselves? Where do they go when wanderlust beckons? As it turns out, Italy’s domestic tourism scene is thriving, bursting with hidden gems and contributing significantly to the national economy. Let’s delve into the fascinating world of Italian domestic tourism through the lens of statistics and explore the impact it has on the “Bel Paese.”
Top Destinations: Where Italians Flock
When it comes to vacation time, Italians often have their sights set on their own stunning backyard. The destinations below hold a special place in the hearts of locals. Let’s explore where Italians flock for their slice of la dolce vita!
- Emilia-Romagna: This foodie paradise, home to Parma ham and Parmesan cheese, reigns supreme with over 26 million overnight stays in 2022. Its beaches, amusement parks, and artistic cities like Bologna continue to lure domestic travellers.
- Tuscany: Rolling hills, charming villages, and world-renowned vineyards make Tuscany a perennial favourite. It saw almost 20 million overnight stays in 2022, showcasing its enduring appeal for Italian travellers.
- Southern Italy: In 2022, Apulia, Sicily, and Campania emerged as veritable tourism hotspots, drawing in a staggering influx of over 18 million domestic tourists. Blessed with pristine beaches, ancient ruins, and a vibrant cultural tapestry, these regions not only provide a sun-drenched escape but also serve as a captivating gateway to the authentic essence of Italian life.
Economic Impact: More Than Just Souvenirs
According to Statista, travel and tourism contributed to the Italian GDP by over 190 billion euros in 2022, remaining 3% lower than in 2019, the year prior to the coronavirus (COVID-19) pandemic. Similarly, these industries’ total contribution to employment declined by roughly 5% over the same period, with travel and tourism directly and indirectly supporting around 2.7 million jobs in 2022.
Domestic tourism is a significant contributor to the Italian economy. In 2022, domestic visitors accounted for the highest share of travel and tourism spending in Italy, representing over 70% of the total expenditure. That year, domestic tourism spending in Italy amounted to more than 112 billion euros, surpassing pre-pandemic levels.
Domestic tourism has a positive impact on the economy in several ways. Firstly, it generates revenue for businesses in the tourism industry, such as hotels, restaurants, and tour operators. This revenue, in turn, supports jobs and contributes to the overall growth of the economy.
Secondly, domestic tourism can help to reduce the seasonality of the tourism industry, as it provides a more stable source of demand throughout the year. Finally, domestic tourism can help to promote cultural exchange and understanding between different regions of Italy, which can have positive social and economic effects.
International Tourism in Italy Statistics

Italy attracts a significant number of international tourists, with top countries including France, Germany, and the United States. Visitors enjoy exploring Italy’s beautiful cities such as Rome, Florence, and Venice. Additionally, many tourists choose to visit Italy for leisure purposes rather than work-related trips. Discover more about the international tourism trends in Italy by reading further.
Number of International Tourist Arrivals
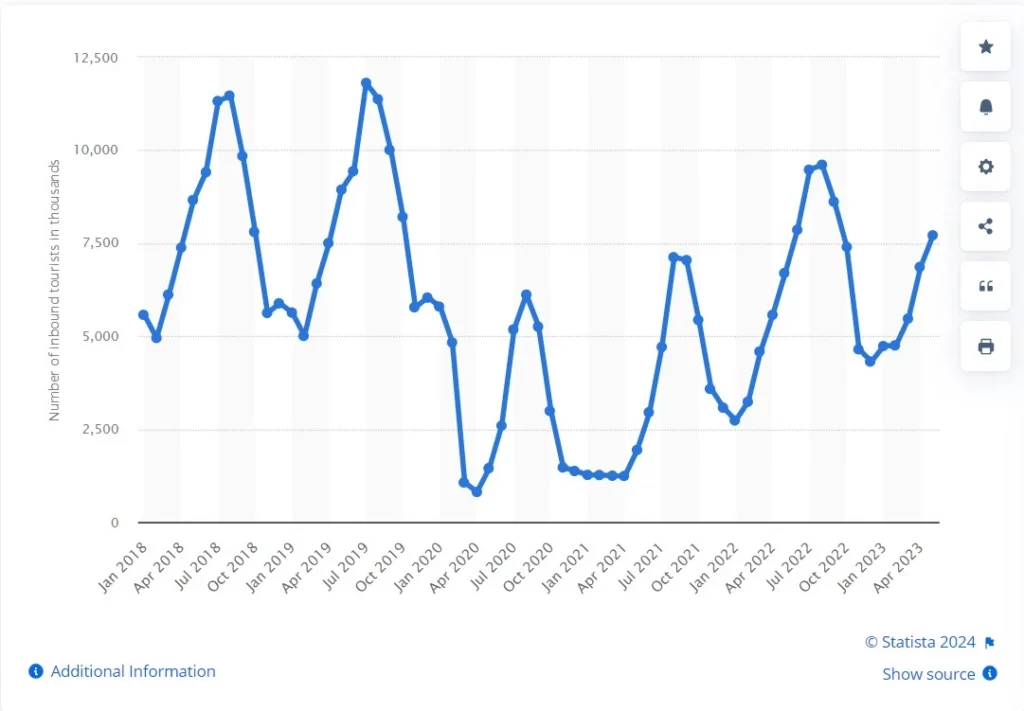
Italy attracts a large number of international tourists each year. In 2019 alone, there were over 95 million international tourist arrivals in the country. This reflects the popularity of Italy as a travel destination and highlights its thriving tourism industry. In 2022, the number of international tourist arrivals in Italy, including overnight and same-day visitors, reached 74.7 million. This is a significant increase from the previous year but still below pre-pandemic levels.
Top Countries Visitors Come From
In 2022, Germany, France, and Austria emerged as the top source markets for international tourism in Italy, collectively contributing significantly to the country’s vibrant tourism landscape. Germany led the pack with 17.2% of the total market share, boasting approximately 12.8 million arrivals, solidifying its position as the foremost inbound travel market based on both visitor numbers and spending.
France followed closely behind with a substantial 14.5% market share. Astonishingly, Austria secured the third spot with a noteworthy 9.3% contribution to Italy’s international tourism. Beyond mere arrival statistics, the spending patterns of international tourists added an intriguing layer to the narrative.
While Germany retained its lead in terms of tourist spending, the United States emerged as the second-highest contributor in this category, demonstrating a robust economic impact. France and the United Kingdom further enriched Italy’s tourism economy, highlighting the diverse and global appeal of the Italian experience.
Seasonal Patterns
Italy’s tourism landscape experiences distinct seasonal patterns that shape the ebb and flow of international arrivals throughout the year. The summer triumvirate of June, July, and August emerges as the peak tourism season, witnessing a surge in international visitors flocking to the country. The allure of sun-soaked landscapes, cultural festivals, and historical marvels during these months make Italy a premier summer destination.
Conversely, the winter months of December, January, and February constitute the off-peak period, marked by a lull in international arrivals. The colder weather and the absence of major festivals contribute to the decrease in tourist numbers during this time. Weather, festivals, and events wield a considerable influence on tourism patterns in Italy, acting as key determinants of visitor influx.
Notably, the Carnival of Venice, an annual extravaganza held in February, stands out as a beacon, attracting a significant throng of tourists who come to witness the city’s vibrant celebration and indulge in the unique Carnival experience. These seasonal nuances underscore the dynamic and multifaceted appeal of Italy as a year-round destination.
Top Italian Destinations for International Tourists
Embark on a journey through Italy’s most coveted destinations, where each city and region tells a tale of history, art, and unparalleled charm. Topping the list as perennial favourites for international tourists are:
Rome: Eternal City of Wonders
No journey to Italy is complete without a pilgrimage to Rome, the “Eternal City”, where history whispers around every corner. From the awe-inspiring grandeur of the Colosseum to the delicate artistry of the Trevi Fountain, Rome is a living museum, its streets echoing with the footsteps of emperors, saints, and artists who shaped the course of civilisation. Visitors flock to bask in the city’s vibrant energy, delve into its rich history, and indulge in the incomparable flavours of Roman cuisine.
Venice: A Floating Marvel
Venice, the “City of Canals,” is a place where reality surrenders to dreams. Gondolas glide through labyrinthine waterways, reflected in the shimmering beauty of centuries-old palazzos. St. Mark’s Square thrums with life, its gilded basilica a testament to Venetian artistry.
Here, getting lost is a part of the magic, every corner revealing a hidden gem, every bridge whispering a romantic tale. Whether you’re serenading your loved one under a starlit sky or getting lost in the labyrinthine alleyways, Venice promises an experience unlike any other.
Florence: Renaissance Splendour
“Firenze”, the cradle of the Renaissance, is a feast for the senses. Botticelli’s angels smile from the Duomo’s cupola, Michelangelo’s David stands triumphant in the Accademia Gallery, and Brunelleschi’s dome pierces the Tuscan sky.
This city overflows with artistic and architectural treasures, each masterpiece a testament to human ingenuity and beauty. Wander through the bustling market of Ponte Vecchio, savour a glass of Chianti overlooking the rolling hills and lose yourself in the intoxicating blend of art, history, and la dolce vita that defines Florence.
Milan: Fashion and Innovation
Milan, the fashion capital and economic powerhouse, beckons with its modernity and style. The soaring Gothic spires of the Duomo pierce the sky, while sleek skyscrapers house fashion houses and design studios.
In Milano, haute couture meets cutting-edge art, and the streets thrum with the rhythm of a city perpetually on the move. Shop for the latest trends, marvel at masterpieces in the Pinacoteca di Brera, and fuel your caffeine addiction in a stylish café—Milan promises an experience as chic as it is unforgettable.
Tuscany: A Picturesque Haven
Beyond the bustling cities, Tuscany’s rolling hills, cypress-lined lanes, and charming villages offer a taste of authentic Italian life. Sun-drenched vineyards give way to medieval towns perched on hilltops, each one a postcard paradise. Savour freshly baked bread drizzled with local olive oil, sip Chianti under the Tuscan sun and lose yourself in the rhythm of a slower pace. Tuscany is an escape, a haven for those seeking the timeless essence of la dolce vita—a reminder that sometimes, the greatest treasures are found in the simple pleasures.
These destinations not only represent the quintessence of Italy’s allure but also embody the diverse facets of the country’s rich heritage. Whether wandering through ancient ruins, cruising along romantic canals, or indulging in world-class art, each city and region on this list contributes to the timeless allure that makes Italy an irresistible destination for international travellers.
Colosseum gladiator vibes or Tuscan vineyard chills? Italy’s tourism tapestry caters to all wanderlust cravings. International tourists are back, painting the scene with their diverse cultural brushstrokes. But don’t underestimate the locals! Domestic tourism keeps the beat pumping, from rediscovering family-friendly beaches to rediscovering ancient ruins with fresh eyes. So, grab your sense of adventure, join the dance, and let Italy’s magic weave its spell, whether you’re a first-time visitor or a local rediscovering your corner of paradise.

Top Things To Do in Hamburg: A Hamburger’s Guide!
Germany
27/04/2024

Take a Look at the Astounding Scenery of County Kerry
County Kerry
27/04/2024

Famous Haunted Houses in Egypt: Spooky Stories for Halloween
Destinations
27/04/2024

St. Paul’s Cathedral – London Attractions
England
27/04/2024

Great Scotland Yard – London Attractions
England
27/04/2024